Project Portfolio
A sneak peek into my geeky side.
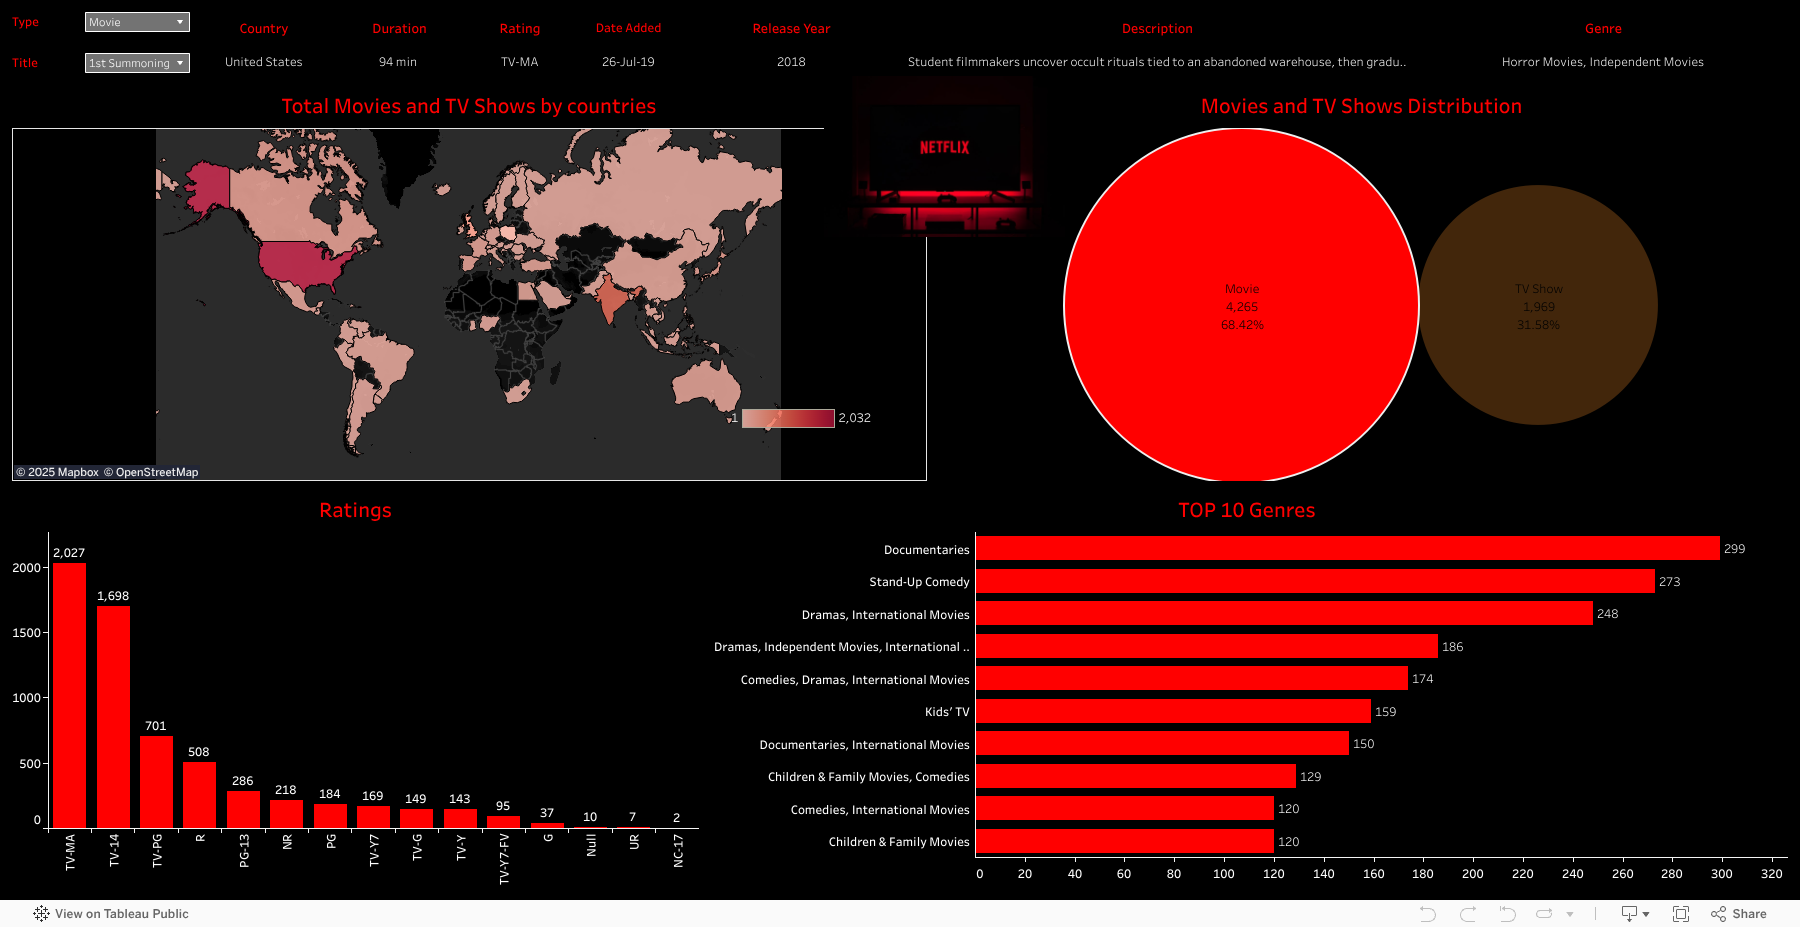
Netflix Dashboard
- Objective: Develop a visualization to showcase data of 10000 movies and sort them according to various filters as per viewer’s choice.
- Achievement: Joined spatial data in a relational database, designed an interactive Tableau dashboard to visualize different types of movies based on filters like, duration, genre, star cast etc. and other filters as per viewer’s choice.
IMDB Dashboard
- Objective: Develop a visualization to showcase data of top 1000 movies as per no. of votes on IMDb and sort them according to comparative filters.
- Achievement: Joined spatial data in a relational database, designed an interactive Tableau dashboard to visualize different types of movies based on filters like highest gross, most viewed genre, most movies based on year etc.

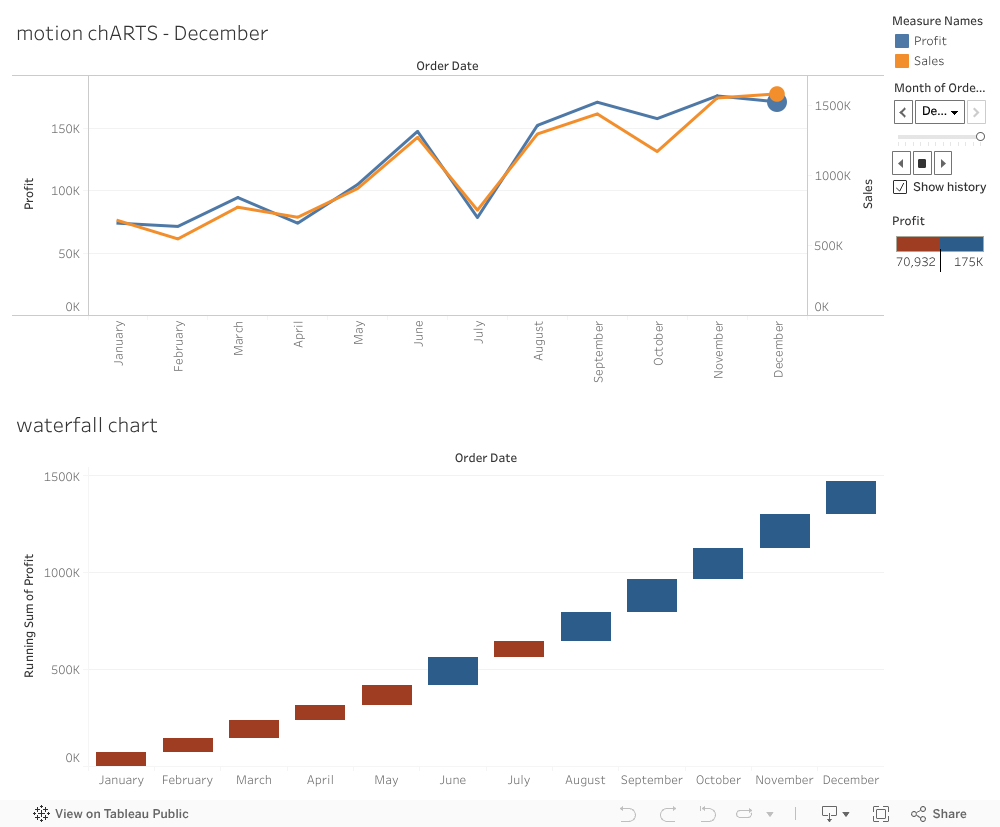
Sales Dashboard
- Objective: To see growth in revenue over the years for business decisions
- Achievement: Joined company data to better visualize revenue for the past years and color encode the profit and loss years.
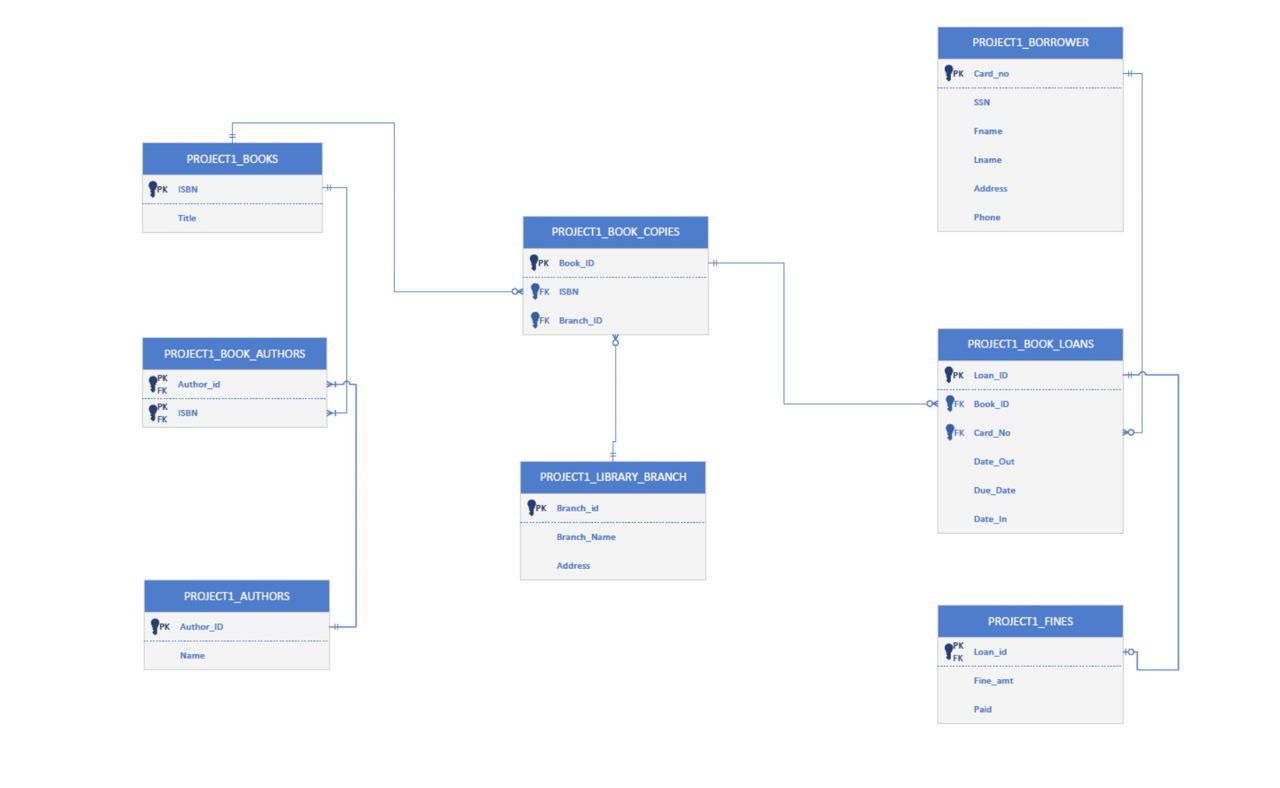
Data Manipulation and Library Database - Book Search Function
- Objective: To create a book search function by loading and constructing DB Tables and executing 100+ DDL and DML queries
- Achievement: Designed ER Diagrams, and conceptual models, established database objects, and wrote SQL queries to normalize and populate data into 3NF tables from the provided raw files. Generated test data to simulate book borrowing and fines transactions for a library